
Introduction
Social accounts have emerged as an essential framework within economics and business studies, particularly in analyzing an organization’s broader impact on society. Unlike conventional accounting that focuses solely on financial metrics, social accounting offers a more holistic view of an organization’s performance by encompassing social, environmental, and ethical dimensions. This method enables stakeholders to assess how organizations contribute to societal well-being and sustainability. For economics graduates, understanding social accounts is crucial for evaluating the interplay between economic activities and social responsibilities.
Understanding Social Accounts
Social accounts, often referred to as “social accounting,” are specialized records that document and report an organization’s social and environmental impact. These accounts aim to quantify the non-financial aspects of an organization’s activities, such as community engagement, employee welfare, and environmental conservation efforts. Social accounting emerged in response to growing demands for corporate social responsibility (CSR) and sustainability, providing stakeholders with a transparent view of how businesses and institutions impact society beyond profit-making. Social accounts are a comprehensive framework for understanding the economic structure and interactions within an economy. They provide a detailed picture of the flow of goods, services, and income among different economic agents, such as households, businesses, and the government.
Types of Social Accounting
The following are the three main types of social accounting:
Environmental Accounting:
This type reveals how a company’s actions affect nature. Even if a company claims to be eco-friendly, its true impact may differ. Examples include:
- Using resources like oil, petroleum, and water.
- Cutting trees and planting new ones to compensate.
- Damaging land through activities.
- Setting up water treatment plants to reuse water.
- Focusing on reducing, reusing, and recycling waste.
- Contributing to air, soil, water, and noise pollution.
Sustainability Accounting:
This provides info on social and economic sustainability, impacting society and an organization’s performance. Examples include:
- Impact on local communities’ health due to emissions.
- Fair compensation to farmers and artisans.
- Installing solar power plants to save energy.
- Ethical initiatives benefiting society.
- Ensuring employee safety.
- Establishing educational facilities in industrial areas.
- Fair and timely tax payments.
National Accounting:
This analyzes a country’s economic activities, examining expenditures and returns, project efficiency, and public sector management.
- Does project cost exceed approval?
- Has the planned return rate been met?
- Is project planning efficient?
- Are project execution systems sound?
- Are cost control measures effective?
- Are efficient operating procedures followed?
- Is public sector management efficient?
Benefits of Social Accounts
Enhanced Accountability and Transparency
Social accounts provide transparency by allowing stakeholders to see an organization’s social, ethical, and environmental impacts. In doing so, organizations demonstrate accountability to the communities in which they operate. This can foster trust and credibility, particularly in industries where ethical concerns are high, such as in manufacturing or natural resource extraction.
Informed Decision-Making and Strategic Planning
By examining social accounts, organizations can make decisions that align with both their financial and social objectives. For instance, understanding the environmental impact of production processes enables companies to invest in more sustainable practices, which can reduce long-term costs and regulatory risks.
Improved Stakeholder Engagement
Social accounting serves as an important tool for engaging a wide array of stakeholders. Employees, customers, and communities increasingly value transparency and ethical practices, and social accounts allow organizations to communicate their efforts in these areas effectively. This engagement strengthens relationships and enhances an organization’s social license to operate.
Enhanced Corporate Image and Competitiveness
Organizations with positive social accounts often gain a competitive advantage by attracting customers, investors, and employees who value social responsibility. By showcasing a commitment to social and environmental issues, these organizations can build a reputable brand, differentiate themselves in the market, and potentially improve profitability.
Facilitating Sustainable Development Goals (SDGs)
Social accounts play a key role in monitoring and achieving sustainable development goals (SDGs). By tracking contributions to goals such as environmental sustainability, gender equality, and economic inclusion, organizations align their objectives with broader global agendas, demonstrating a commitment to societal progress.
Economic Analysis:
- Policy Evaluation: Assess the impact of economic policies on various sectors and groups.
- Forecasting: Predict future economic trends and potential risks.
- Structural Analysis: Understand the underlying structure of the economy and its vulnerabilities.
Data Consistency:
- Integrated Data: Ensures consistency across different economic data sources.
- Error Detection: Helps identify and correct errors in economic data.
Interdisciplinary Research:
- Multidisciplinary Applications: Used in economics, sociology, and environmental studies.
- Cross-Sectoral Analysis: Enables analysis of interactions between different sectors of the economy.
A social accounts matrix (SAM) is a structured framework that captures and organizes data on an organization’s social, economic, and environmental impacts. By expanding beyond conventional financial accounts, a SAM allows organizations to document their influence on a range of stakeholders—such as employees, suppliers, communities, and the environment—in a tabular or matrix format. Each row and column in a SAM typically represents different sectors, activities, or groups, showing interactions like expenditures, resource allocations, or social contributions across these categories.
The social accounts matrix (SAM) is a comprehensive, economy-wide database that captures the flow of all economic transactions within an economy. Here’s a simplified representation of a SAM:
| Economic Agent | Households | Firms | Government | Rest of the World | Total |
|---|---|---|---|---|---|
| Households | – | Consumption | Taxes | Imports | Income |
| Firms | Wages | – | Subsidies | Exports | Revenue |
| Government | Transfers | Subsidies | – | Foreign Aid | Government Expenditure |
| Rest of the World | Remittances | Imports | Foreign Aid | – | Net International Transactions |
| Total | Household Income | Production Costs | Government Revenue | International Receipts | Total Output |
In this matrix:
Households receive income from wages and transfers, spend on consumption, pay taxes, and save the rest.
Firms generate revenue from selling goods and services, pay wages, and receive subsidies.
Government collects taxes, spends on public services, and provides subsidies.
Rest of the World represents international transactions such as imports, exports, remittances, and foreign aid.
This structured approach helps in comprehensively understanding the economic interactions between different agents and sectors within the economy.
In macroeconomics, we use different ways to measure a country’s economic performance, with each one focusing on a unique aspect. Three common measures are Gross Domestic Product (GDP) at market price, Gross Value Added (GVA) at basic price, and Gross National Product (GNP) at factor cost. Each helps us understand the economy differently, from the value of all goods and services produced within a country to the income earned by a country’s citizens worldwide. Let’s break down what each term means in simple terms and why they are different from each other.
1. Gross Domestic Product (GDP) at Market Price
What It Is: GDP at market price is the total value of all goods and services produced within a country’s borders during a specific period (like a year). It’s measured at the actual prices paid by consumers, which means it includes taxes on the products (like VAT or sales tax) but does not subtract any subsidies (financial support) provided by the government.
In Simpler Terms: Think of GDP at market price as the full price tag on everything made in a country, whether it’s cars, phones, or food. It’s the amount that customers pay in the marketplace, including any taxes added. This measure tells us how much people are spending in the economy and gives a sense of the country’s economic health.
Example: Imagine a smartphone made in India that costs ₹20,000, including all applicable taxes. This full price is part of the GDP at market price because it reflects what the consumer actually paid.
2. Gross Value Added (GVA) at Basic Price
What It Is: GVA at basic price measures the value added by producers within the economy but before taxes on products are added. It also includes any subsidies producers may have received from the government. This metric focuses on the productivity of different sectors, like agriculture, manufacturing, and services, by looking at the value they each add to the economy.
In Simpler Terms: GVA is like peeling back the layers of a price tag to see only the actual value that companies or industries add. For instance, when a car manufacturer makes a car, GVA considers only the worth added by that manufacturer, without adding any taxes or subtracting any subsidies. This way, GVA gives a clear look at how productive each sector is without the influence of taxes.
Example: If an Indian car manufacturer adds ₹10 million in value through its operations, this is the GVA at basic price for the automotive sector. It shows the contribution of this sector to the economy, ignoring any product taxes.
3. Gross National Product (GNP) at Factor Cost
What It Is: GNP at factor cost is the total value of goods and services produced by a country’s citizens, whether they are working domestically or abroad. This measure looks at production at the actual cost of making things (including wages, rent, and profits) but excludes taxes and subsidies on products. It’s a good measure of what a country’s citizens earn, regardless of where they are.
In Simpler Terms: GNP at factor cost is like adding up the income of all a country’s citizens, whether they are working within the country or in a foreign country. It’s a way to measure a country’s income by looking at only the costs of production (wages, rents, profits), ignoring taxes and subsidies.
Example: If an Indian company has a factory in the U.S. and earns ₹5 million there, this amount would be included in India’s GNP, because it’s income earned by Indian citizens, even though it was generated abroad.
Key Differences
-
Focus on Production Location vs. Citizens:
- GDP measures the value of goods and services produced within the country’s borders, regardless of who produced them.
- GVA is also domestic but zooms in on the value each sector (like manufacturing or services) adds to the economy.
- GNP considers only what citizens of a country produce, whether they’re within the country or abroad.
-
Treatment of Taxes and Subsidies:
- GDP at Market Price includes product taxes and excludes subsidies, giving a view of the consumer price.
- GVA at Basic Price ignores product taxes and includes subsidies, focusing on pure production value.
- GNP at Factor Cost excludes both taxes and subsidies, focusing solely on costs like wages and profits.
-
Purpose and Use:
- GDP at Market Price is widely used to get a sense of the economic size and growth.
- GVA at Basic Price helps in analyzing productivity by sector, letting us see which industries are contributing most.
- GNP at Factor Cost reflects the income earned by a country’s citizens, giving insight into their economic welfare.
Conclusion
In short, while GDP, GVA, and GNP all measure economic activity, they serve different purposes. GDP at market price shows us what people are spending within a country; GVA at basic price reveals how productive each industry is; and GNP at factor cost tells us about the income earned by citizens worldwide. By understanding these measures, economists and policymakers can make better decisions about the economy and focus on areas that need improvement.
In national income accounting, there are three main methods for calculating a country’s national income: the Production (or Output) Method, the Income Method, and the Expenditure Method. Each method takes a unique approach to capture the economic activity within a country, and they can all yield the same result when calculated accurately. However, they focus on different aspects of the economy. Let’s explore each method in detail and understand the differences among them.
1. The Production (Output) Method
Definition: The Production Method, also known as the Output Method, measures national income by calculating the total value of goods and services produced within an economy. This approach aggregates the value of output from all sectors, such as agriculture, industry, and services, and subtracts the cost of intermediate goods used in production to avoid double counting.
Process:
- Identify all sectors of production (e.g., primary, secondary, and tertiary sectors).
- Calculate the total value of output from each sector.
- Subtract the value of intermediate goods (raw materials or semi-finished products used in the production process) to obtain the Gross Value Added (GVA).
- Add up the GVA from all sectors to arrive at Gross Domestic Product (GDP) at factor cost.
Use: The Production Method is valuable for sectoral analysis, as it highlights the contributions of different sectors to the economy, helping policymakers understand which sectors drive growth.
Example: If the agriculture sector produces crops worth ₹10 million and uses inputs worth ₹2 million, the GVA is ₹8 million for that sector.
2. The Income Method
Definition: The Income Method calculates national income by adding up all incomes earned by individuals and businesses within an economy over a given period. This approach focuses on the income side of the economy and includes wages, rents, interest, and profits.
Process:
- Identify and categorize income sources: wages and salaries (earned by labor), rents (earned by landowners), interest (earned by capital), and profits (earned by entrepreneurs).
- Sum up all these incomes to find Net Domestic Product (NDP) at factor cost.
- To calculate Gross Domestic Product (GDP), add depreciation (the loss in value of capital assets over time) to NDP.
- Adjust for net foreign factor income (income earned by residents from abroad minus income earned by foreigners domestically) to arrive at Gross National Product (GNP) at factor cost.
Use: The Income Method provides insight into how the nation’s income is distributed among different factors of production, making it useful for evaluating economic inequality and income distribution.
Example: If total wages are ₹15 million, rents are ₹5 million, interest is ₹3 million, and profits are ₹7 million, the total income generated is ₹30 million.
3. The Expenditure Method
Definition: The Expenditure Method calculates national income by summing up all expenditures incurred on the final goods and services produced within an economy. This method looks at the spending aspect of the economy, capturing the total demand for the country’s output.
Process:
- Identify and aggregate the four main types of expenditures: consumption expenditure (spending by households on goods and services), investment expenditure (spending by businesses on capital goods), government spending (expenditures on public goods and services), and net exports (exports minus imports).
- Add up these expenditures to obtain Gross Domestic Product (GDP) at market price.
Use: The Expenditure Method is often used to understand the sources of demand within the economy. It helps policymakers gauge the levels of consumption, investment, and government spending and understand their effects on economic growth.
Example: If consumption is ₹40 million, investment is ₹20 million, government spending is ₹15 million, and net exports are ₹5 million, then the GDP at market price is ₹80 million.
Differences
Focus Area:
- Production Method: Focuses on the value of output produced by each sector.
- Income Method: Focuses on the income earned by different factors of production.
- Expenditure Method: Focuses on the total spending on goods and services within the economy.
Perspective on Economic Activity:
- Production Method views the economy from the production or supply side.
- Income Method looks at the income generation or distribution aspect.
- Expenditure Method emphasizes the demand or spending side.
Measurement Approach:
- Production Method measures value added by producers.
- Income Method adds up all incomes earned.
- Expenditure Method adds up all spending on final goods and services.
The Production, Income, and Expenditure Methods each provide a different lens for measuring national income, giving policymakers and economists a fuller understanding of economic activity. Together, they provide insights into production, income distribution, and demand within an economy, essential for comprehensive economic analysis and policy decisions. Although they approach national income from different angles, in a balanced economy, all three methods should theoretically yield the same national income figure, ensuring a reliable assessment of economic performance.
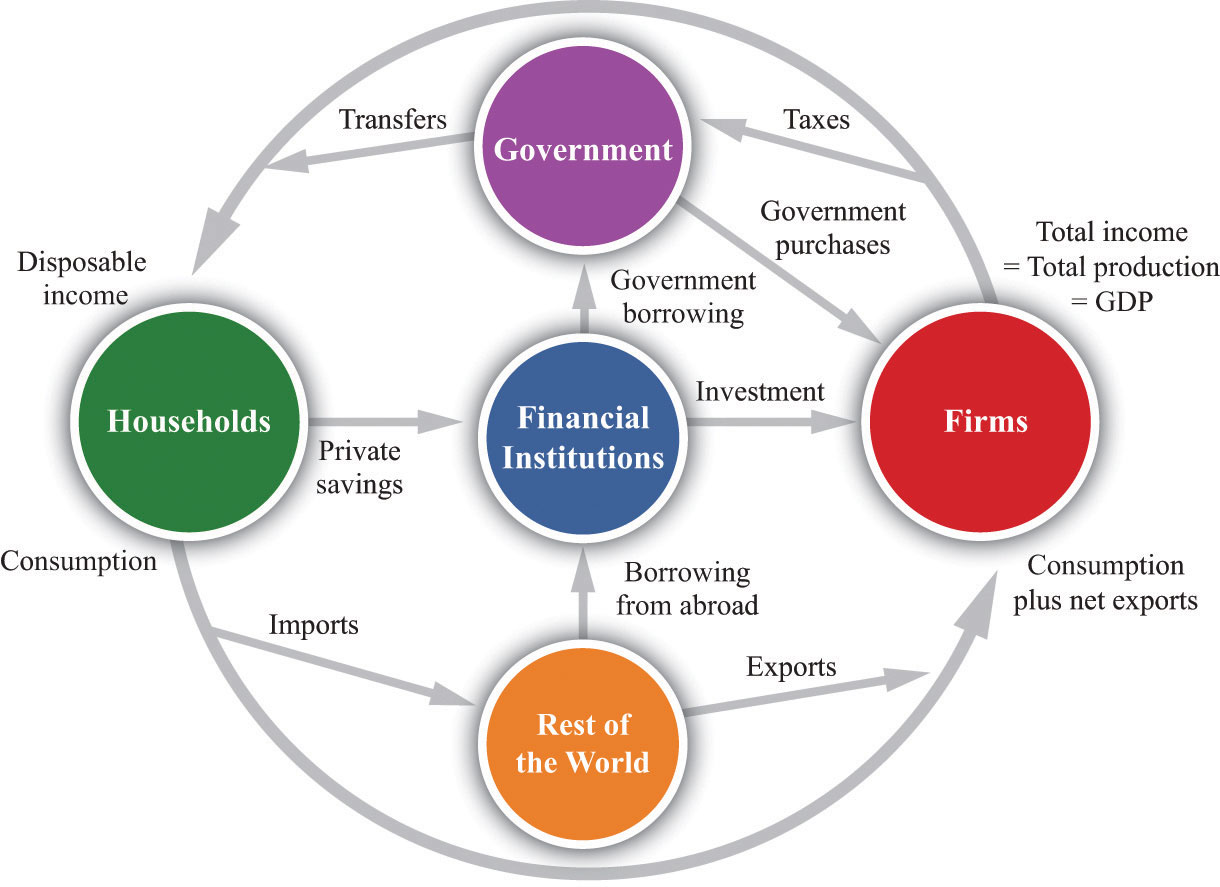
The circular flow of income or circular flow is a model of the economy in which the major exchanges are represented as flows of money, goods and services, etc. between economic agents. The flows of money and goods exchanged in a closed circuit correspond in value, but run in the opposite direction. The circular flow analysis is the basis of national accounts and hence of macroeconomics.
The idea of the circular flow was already present in the work of Richard Cantillon. François Quesnay developed and visualized this concept in the so-called Tableau économique. The circular flow of income illustrates how money moves within an economy, helping to understand the relationships between households, businesses, government, and the foreign sector. This model can be analyzed within two contexts: a closed economy (without international trade) and an open economy (which includes foreign trade). Both models are essential for understanding how income is generated and distributed across different sectors of the economy.
1. Circular Flow of Income in a Closed Economy
A closed economy has no interaction with foreign economies—meaning there are no imports or exports. This model includes two main sectors: households and firms. Here, households supply factors of production (land, labor, capital, and entrepreneurship) to firms, which, in turn, produce goods and services.

- Factor Market: Households provide labor, capital, land, and entrepreneurship to firms, which are compensated with wages, rent, interest, and profits.
- Goods Market: Households spend their income on goods and services produced by firms. This spending returns to firms as revenue, which is then used to pay for production factors, continuing the flow.
Key Aspects:
- No International Trade: Since there’s no import or export activity, this economy solely depends on domestic production and consumption.
- Savings and Investments: In a more detailed closed economy model, households might save some income, and firms invest. This is facilitated through financial institutions, which manage savings and loans, keeping the economy in equilibrium.
- Equilibrium: In a closed economy, the total income earned by households equals the total expenditure on goods and services
- Leakages and Injections: In a real-world economy, there are leakages (like savings, taxes) and injections (like government spending, investment) that can disrupt the equilibrium
- Simplified Model: The closed economy model is a simplified representation of a real economy. In reality, economies are open and interact with other economies through trade and capital flows
2. Circular Flow of Income in an Open Economy
An open economy incorporates the foreign sector, which adds imports, exports, and foreign investments to the circular flow. This model includes households, firms, government, and the foreign sector, which results in a more complex flow of income. An open economy is an economic system that interacts with other economies. Unlike a closed economy, it involves international trade and capital flows. This interaction introduces additional components to the circular flow of income model.
Exports: Increase the income and production within the economy, boosting economic growth.
Imports: Reduce the income available for domestic production and can lead to trade deficits
Government: Through taxation and spending, the government can influence the level of economic activity.
Financial Sector: Savings and investment play a crucial role in economic growth by providing funds for businesses to expand and innovate.
Equilibrium in an Open Economy:
In an open economy, equilibrium occurs when the total income generated in the economy equals the total expenditure on goods and services, including exports and imports. Any imbalance in the flow of income and expenditure can lead to economic fluctuations.
Factors Affecting the Circular Flow in an Open Economy:
- Global Economic Conditions: International economic conditions, such as global economic growth or recession, can impact exports and imports
- Exchange Rates: Fluctuations in exchange rates can affect the competitiveness of domestic goods in foreign markets.
- Government Policies: Fiscal and monetary policies implemented by the government can influence economic activity and the flow of income.
- International Trade Agreements: Trade agreements can impact the flow of goods and services between countries
- Understanding the circular flow of income in an open economy is crucial for analyzing the economic performance of a nation, identifying potential economic challenges, and developing effective economic policies.
Components:
- Domestic Flow (similar to closed economy): Households and firms interact in the factor and product markets.
- Government: Collects taxes from households and firms, injects spending through public services, and may offer subsidies or welfare payments.
- Foreign Sector: In an open economy, exports represent income received from abroad, while imports represent payments made to foreign entities.
Key Aspects:
- Imports and Exports: Imports are leakages from the economy, reducing domestic income flow, while exports are injections, increasing national income.
- Foreign Exchange: An open economy requires currency exchange to facilitate international trade.
- Trade Balance: The net of exports and imports affects the overall income flow, influencing national income and production levels.
Comparison and Importance
Flow Completeness:
- Closed Economy: Simple, with a complete cycle between households and firms. The economy relies solely on internal production and consumption.
- Open Economy: Complex, with the addition of foreign trade and government activities. It provides a more realistic view, as most modern economies are open to trade.
Injections and Leakages:
- Closed Economy: Only savings and investments affect the flow.
- Open Economy: Injections include investments, government spending, and exports, while leakages include savings, taxes, and imports.
Economic Insight:
- Closed Economy: Provides insight into internal dynamics, helpful for theoretical understanding.
- Open Economy: Reflects real-world scenarios, highlighting trade impact, policy decisions, and global economic interactions.
The circular flow model helps economists understand how income circulates within an economy, driving production, consumption, and growth. In a closed economy, the cycle is simpler, focusing on domestic interactions. An open economy introduces more variables like imports, exports, and government influence, making it a more practical representation for modern economies. By analyzing both models, economists and policymakers can assess economic health, make informed decisions, and implement policies that promote balanced economic growth and stability.
A social accounting matrix (SAM) can be defined as an organized matrix representation of all transactions and transfers between different production activities, factors of
production, and institutions (households, corporate sector, and government) within the economy and with respect to the rest of the world. A SAM is thus a comprehensive accounting frame work within which the full circular flow of income from production to factor incomes, household income to household consumption, and back to production is
captured. All the transactions in the economy are presented in the form of a matrix in a SAM. A Social Accounting Matrix (SAM) is a comprehensive framework that provides a detailed picture of all economic transactions within an economy. It’s like a giant spreadsheet that shows how money flows between different sectors and institutions, such as households, businesses, and the government. A typical SAM includes rows and columns representing different economic agents and sectors such as households, firms, government, and foreign entities. The entries in the matrix reflect monetary flows between these agents for goods, services, and factor incomes.
Key Components of SAM:
Households: Income from wages, rents, interests, and profits; expenditures on consumption, taxes, and savings.
Firms: Revenue from sales; expenditures on wages, rents, interests, inputs, and dividends.
Government: Revenue from taxes; expenditures on public services and transfers.
Rest of the World: Exports and imports; foreign aid and remittances.
Simplified Example of SAM:
| Economic Agent | Households | Firms | Government | Rest of the World | Total |
|---|---|---|---|---|---|
| Households | – | Consumption | Taxes | Imports | Income |
| Firms | Wages | – | Subsidies | Exports | Revenue |
| Government | Transfers | Subsidies | – | Foreign Aid | Government Expenditure |
| Rest of the World | Remittances | Imports | Foreign Aid | – | Net International Transactions |
| Total | Household Income | Production Costs | Government Revenue | International Receipts | Total Output |
Uses of SAM:
Policy Analysis: SAMs are instrumental for policy analysis, helping policymakers understand the impact of fiscal, monetary, and trade policies on different sectors and agents within the economy.
Economic Planning: They aid in economic planning by providing insights into the distribution of income and resources, helping to identify areas for intervention and investment.
Impact Assessment: SAMs are used to assess the impact of economic shocks, such as changes in commodity prices or policy reforms, on different segments of the economy.
Social and Economic Analysis: They provide a framework for analyzing the social and economic interactions, including the distribution of income among households and the flow of goods and services.
- Economic Agents: These include various sectors of the economy such as households, firms, government, and the rest of the world.
- Transactions: The matrix captures all the economic transactions, including:
- Production: The flow of goods and services from producers to consumers, government, and other producers.
- Income Generation: The flow of income from production activities to factors of production like labor and capital.
- Income Distribution: The distribution of income among different groups of households.
- Consumption Expenditure: The spending of income by households on goods and services.
- Government Transactions: The government’s revenue from taxes and expenditure on various programs.
- International Transactions: The flow of goods, services, and capital between the domestic economy and the rest of the world.
A SAM is a double-entry system, meaning that each transaction is recorded twice: once as a source of income and once as a use of expenditure. This ensures that the total income of the economy equals its total expenditure.
Advantages of Using SAM:
- Comprehensive View: SAM provides a holistic view of the economy, capturing the interconnections between different sectors and agents.
- Policy Analysis: It’s a valuable tool for policy analysis, as it can be used to assess the impact of different policies on various sectors of the economy.
- Impact Assessment: SAM can be used to evaluate the impact of shocks, such as changes in prices or government policies, on the economy.
- Data Consistency: SAM ensures data consistency by reconciling information from different sources.
- Interdisciplinary Applications: It can be used in various fields like economics, sociology, and environmental science.
Limitations of SAM:
- Data Intensive: Constructing a SAM requires a significant amount of detailed data, which can be challenging to obtain.
- Static Nature: SAMs typically provide a static snapshot of the economy, limiting their ability to capture dynamic changes over time.
- Simplifications: To make the analysis manageable, SAMs often involve simplifying assumptions about the economy.
The Social Accounting Matrix is a powerful tool for economists and policymakers. It provides a detailed snapshot of the economy, capturing the complex interactions between different economic agents and sectors. By understanding these interactions, policymakers can design more effective economic policies, ensure equitable resource distribution, and promote sustainable economic growth. Social Accounting Matrices are a powerful tool for understanding the complex interrelationships within an economy. By providing a detailed and consistent picture of economic flows, SAMs can help policymakers, researchers, and analysts make informed decisions and develop effective policies.
Environmental accounting is a system that integrates environmental factors into traditional financial accounting. It aims to measure the environmental impact of economic activities, both positive and negative, and incorporate these into decision-making processes. By doing so, it provides a more comprehensive view of an organization’s or a nation’s overall performance, taking into account not only economic and social factors but also environmental factors. Environmental accounting is an essential approach that integrates environmental costs into traditional accounting. This accounting method focuses on measuring, recording, and reporting the environmental impacts associated with a business’s activities, helping organizations make environmentally responsible financial decisions. Environmental accounting tracks the use of natural resources, pollution, waste, and compliance with environmental regulations. By doing so, it allows organizations to understand the economic effects of their environmental choices and align their strategies toward sustainability.

Environmental accounting is typically divided into two parts:
- Internal Environmental Accounting: Tracks the environmental impacts directly related to a firm’s internal operations, such as resource usage, energy consumption, and waste generation. This data helps identify ways to reduce costs, cut waste, and improve sustainability within the organization.
- External Environmental Accounting: Measures the broader impact of a firm’s activities on the environment, including its supply chain and product lifecycle. This aspect is essential for informing stakeholders, such as investors, customers, and regulators, about the company’s environmental performance.
Objectives of Environmental Accounting
The primary goals of environmental accounting are to:
- Quantify the environmental costs and benefits associated with an organization’s actions.
- Improve corporate environmental performance by identifying areas for waste reduction and resource conservation.
- Inform policymakers and help shape effective environmental regulations.
- Enhance transparency by reporting environmental impact data to stakeholders.
- Promote sustainable growth by aligning economic activities with long-term environmental goals.
Types of Environmental Accounting
Environmental accounting can include various methods:
- Environmental Cost Accounting focuses on calculating costs related to environmental harm, such as pollution and waste disposal, which helps firms identify areas for improvement.
- Environmental Performance Accounting tracks efforts toward reducing environmental impact, such as energy usage and pollution control.
- Environmental Product Accounting looks at a product’s lifecycle impact on the environment, from raw material extraction to disposal, enabling firms to make products more eco-friendly.
Merits of Environmental Accounting
Enhanced Resource Management: By tracking resource use, environmental accounting helps companies optimize their operations, reduce waste, and lower their carbon footprint. This contributes to more efficient resource use and cost savings.
Improved Risk Management: Identifying and managing environmental risks—such as pollution or climate change liabilities—can prevent costly legal and regulatory issues. Environmental accounting helps companies take proactive measures to minimize environmental risks and enhance resilience against potential disruptions.
Increased Stakeholder Engagement: Today’s stakeholders, including customers, employees, and investors, are increasingly concerned with environmental issues. Companies that adopt transparent environmental accounting demonstrate their commitment to sustainability, fostering trust and loyalty among stakeholders.
Better Compliance: By regularly monitoring environmental impact, companies can stay compliant with regulatory requirements, reducing the risk of fines and legal issues. Compliance also supports public environmental protection goals and reflects positively on the company.
Enhanced Reputation: A robust environmental accounting system can boost a company’s reputation by signaling a genuine commitment to eco-friendly practices. This enhances brand loyalty and attracts environmentally conscious consumers and investors.
Innovation Opportunities: Environmental accounting encourages companies to find new ways to minimize waste and improve efficiency, often leading to the development of innovative, eco-friendly technologies. These innovations can provide a competitive edge and appeal to customers who prioritize sustainability.
Environmental accounting offers numerous benefits for businesses, governments, and society as a whole:
Improved Decision-Making:
- Informed Choices: By quantifying the environmental costs and benefits of different courses of action, environmental accounting helps decision-makers make more informed and sustainable choices.
- Risk Management: Identifying potential environmental risks and liabilities can help organizations proactively manage these risks, mitigating potential financial and reputational damage.
Enhanced Corporate Responsibility:
- Transparency: Environmental accounting promotes transparency by disclosing the environmental impact of an organization’s operations.
- Stakeholder Engagement: It provides a platform for engaging with stakeholders, including investors, customers, and communities, on environmental issues.
- Reputation Management: Strong environmental performance can enhance an organization’s reputation and brand image.
Resource Efficiency:
- Cost Savings: By identifying areas of inefficiency and waste, environmental accounting can help organizations reduce costs and improve resource productivity.
- Innovation: It can stimulate innovation in developing cleaner technologies and more sustainable business practices.
Policy Formulation and Implementation:
- Evidence-Based Policy: Governments can use environmental accounting data to inform policy decisions and track the effectiveness of environmental regulations.
- Incentives and Disincentives: It can help design effective incentives and disincentives to promote sustainable behavior.
Public Awareness and Engagement:
- Public Education: Environmental accounting can raise public awareness of environmental issues and the impact of human activities on the planet.
- Citizen Participation: It can empower citizens to demand greater accountability from businesses and governments.
Challenges and Limitations
While environmental accounting offers significant benefits, it also faces challenges:
- Data Collection and Measurement: Accurate and reliable data on environmental impacts can be difficult to collect and measure, especially for complex environmental issues.
- Valuation of Environmental Assets: Valuing natural resources and ecosystem services can be challenging, as many of these assets lack market prices.
- Integration with Financial Accounting: Incorporating environmental costs and benefits into traditional financial accounting systems can be complex and requires careful consideration.
- International Standards: The lack of standardized international accounting standards for environmental reporting can hinder cross-border comparisons and analysis.
Despite these challenges, environmental accounting is a rapidly evolving field with the potential to make a significant contribution to sustainable development. By providing a more comprehensive and accurate picture of an organization’s or a nation’s environmental performance, it can drive positive change and help build a more sustainable future.
Macroeconomic Identities for an Open Economy
In an open economy, macroeconomic identities provide a framework for understanding the relationships between key economic variables. These identities help economists analyze the impact of economic policies and external factors on the economy. Macroeconomic identities for an open economy describe the relationships between key economic variables like national income, consumption, investment, government spending, exports, and imports. In an open economy, which engages in trade with other countries, these identities help us understand how domestic and international factors influence aggregate demand, supply, and national output.
1. National Income Identity
In an open economy, total national income (Y) is the sum of consumption (C), investment (I), government spending (G), and net exports (NX, or exports minus imports).
Y = C + I + G + NX
Y: National Income or Gross Domestic Product (GDP)
C: Consumption expenditure
I: Investment expenditure
G: Government expenditure
NX: Net exports (Exports – Imports)
This identity states that total income (GDP) is equal to the sum of consumption, investment, government spending, and net exports.
2. Savings-Investment Identity
S = I + NX
S: National savings
I: Investment expenditure
NX: Net exports
This identity shows the relationship between savings, investment, and net exports. It suggests that national savings are used to finance domestic investment and net foreign investment (or net lending).
3. Current Account Balance
The current account (CA) represents the difference between a country’s total exports and imports of goods, services, and transfers.
CA = NX + NFIA
CA: Current Account Balance
NX: Net exports
NFIA: Net Factor Income from Abroad (income earned by domestic residents from abroad minus income earned by foreign residents domestically)
The current account balance measures the flow of goods, services, and income between a country and the rest of the world. A positive current account balance indicates a surplus, while a negative balance indicates a deficit .If exports exceed imports (X > M), the current account is in surplus; if imports exceed exports (M > X), it is in deficit. A surplus indicates that the country is a net lender to the rest of the world, while a deficit suggests it is a net borrower. This balance is crucial because a persistent current account deficit can lead to increased foreign debt, while a surplus can result in foreign asset accumulation.
4. Capital Account Balance
KA = NFA
KA: Capital Account Balance
NFA: Net Foreign Assets
The capital account balance measures the net change in a country’s foreign assets and liabilities. It includes flows of capital, such as foreign direct investment, portfolio investment, and official reserves.
5. Balance of Payments
BP = CA + KA
BP: Balance of Payments
CA: Current Account Balance
KA: Capital Account Balance
The balance of payments is a record of all economic transactions between a country and the rest of the world over a given period. It includes both current account and capital account transactions.
7.Government Budget Constraint
In an open economy, the government’s budget constraint affects macroeconomic equilibrium. Public savings are calculated as the difference between government revenue (primarily from taxes, T) and government spending:
S public=T−G
If the government spends more than its revenue, it runs a budget deficit, which it may finance by borrowing, adding to public debt. In contrast, a budget surplus means the government saves, potentially reducing debt or investing in other areas. A government’s budget balance can influence national savings and impact the trade balance and domestic investment.
Interconnections and Implications between Identities
These identities are interconnected and have significant implications for economic policy and analysis. For instance:
- Twin Deficits: A persistent current account deficit can be linked to a budget deficit, a phenomenon often referred to as the “twin deficits” problem.
- Exchange Rate Effects: Changes in exchange rates can impact net exports, which in turn can affect the current account and the overall economy.
- Capital Flows: Capital flows, both inflows and outflows, can influence a country’s exchange rate, interest rates, and economic growth.
These identities are interconnected. For example, if a country has a current account deficit, it must finance this deficit through a capital account surplus. This implies that the country is borrowing from abroad to finance its excess spending.
Understanding these macroeconomic identities is crucial for analyzing the economic performance of a country, particularly in the context of globalization and international trade. By examining these identities, economists can assess the impact of economic policies, external shocks, and global economic conditions on a country’s economy.
National income refers to the monetary value over a period of time of the output flow of goods and services produced in an economy.
The Uses of National Income Statistics Measuring the level and rate of growth of national income (Y) is essential to keep track of:
The rate of economic growth
Changes to living standards
Changes to the distribution of income b/w groups
Gross Domestic Product
The total value of output in an economy is the Gross Domestic Product (GDP) and is used to measure economic activity changes. GDP encompasses the production of foreign-owned enterprises located in a country following the foreign direct investment.
There are three different ways to calculate GDP that should all add up to the same amount: The national output is equal to national expenditure (Aggregate demand) which in turn is equal to national income.
The equation for GDP using this approach is
GDP = C(Household spending) + I(Capital investment spending) + G(Government spending) + (X(Exports of Goods and Services)-M(Imports of Goods and Services)
The three different ways to measure GDP are – Product Method, Income Method, and Expenditure Method.
These three calculating GDP methods yield the same result because National Product = National Income = National Expenditure.
The Product Method:
In this method, all goods and services produced during the year in various industries are added up. This is also known as value-added to GDP or GDP at the sector of origin’s cost factor. India includes the following items: agriculture and allied services; mining; development, construction, the supply of electricity, gas, and water, transport, communication, and trade; banking and industrial real estate and property ownership of residential and commercial services and public administration and defence and other services (or government services). It is, in other words, the amount of the added gross value.
The Income Method:
In a nation that produces GDP during a year, people earn income from their jobs. Thus the sum of all factor incomes is GDP by revenue method: wages and salaries (employee compensation) + rent + interest + benefit.
Expenditure Method:
This approach focuses on products and services generated during one year within the region.
GDP is subtracted from the portion of consumption, investment, and government spending expended on imports. Likewise, all manufactured components, such as raw materials used in the manufacture of products for sale, are also exempt.
Thus GDP by expenditure method at market prices is net export, which can be positive or negative.
GDP at Factor Cost:
GDP is the amount of net value added by all producers within the country at the cost factor. Since the net value added is allocated as revenue to the owners of production factors, the sum of domestic factor incomes and fixed capital consumption is GDP (or depreciation).
Thus,
GDP at Factor Cost is equal to the sum of Net value added and Depreciation.
GDP at factor cost includes –
Compensation of employees, i.e., wages, salaries, etc.
Operational surplus, which is both incorporated and unincorporated companies’ business profit.
Mixed-Income of Self- employed.
Conceptually, GDP at the cost factor and GDP at the market price must be equivalent since the cost factor (payments to factors) of the products produced must be equal to the final value at market prices of the goods and services. The retail value of products and services, however, varies from the earnings of the output factors.
Net Domestic Product (NDP):
The NDP is the value of the economy’s net production throughout the year. During the manufacturing process, some of the country’s capital equipment wears out or becomes redundant each year. A certain percentage of the gross expenditure removed from GDP is the amount of this capital consumption.
Net Domestic Product = GDP at the expense of Factor – Depreciation
Nominal and Real GDP:
It is referred to as GDP at current prices or nominal GDP when GDP is calculated based on the current price. On the other hand, if GDP is measured in a given year based on fixed costs, it is referred to as GDP at constant prices, or actual GDP.
Nominal GDP is the value of the goods and services produced in a year, calculated at the current market) prices in terms of rupees (money).
Three Important Methods for Measuring National Income
There are three techniques to compute national income:
Income Method
Product/ Value Added Method
Expenditure Method
Income Method
National income is calculated using this method as a flow of factor incomes. Labor, capital, land, and entrepreneurship are the four main components of production. Labour is compensated with wages and salaries, money is compensated with interest, the land is compensated with rent, and entrepreneurship is compensated with profit.
Furthermore, certain self-employed individuals, such as doctors, lawyers, and accountants, use their own labour and capital. Their earnings are classified as mixed-income. NDP at factor costs is the total of all of these factor incomes.
National Income is calculated as a flow of income in this case.
NI can be calculated as follows:
Employee compensation + Operating surplus (w + R + P + I) + Net income + Net factor income from overseas = Net national income.
Where,
Wage stands for wage and salaries
R stands for rental income.
P stands for profit.
I stand for mixed-income.
Limitations and Criticisms of the Income Method
Exclusion of Non-Market Activities
- The income method struggles to account for non-market activities, such as household work, volunteer work, or illegal activities (e.g., black market or underground economy). While these activities contribute to the economy, they are not reflected in the income data, leading to an underestimation of the total national income.
Difficulties in Measuring Mixed Income
- The concept of mixed income—income derived from self-employed individuals who combine labor and capital—is hard to measure. For instance, the income of a small business owner or farmer is difficult to separate into labor income (wages) and capital income (profits), making the measurement imprecise.
Income from the Informal Sector
- In many developing economies, a significant portion of income is earned in the informal sector, where individuals may not report their earnings or do so underreported. This leads to substantial underreporting of national income, as informal income is largely excluded from official calculations.
Discrepancy in Accounting for Depreciation
- Accurately accounting for depreciation (the reduction in the value of capital goods over time) is a challenge in the income method. If depreciation is not adequately considered, the national income figure could be overstated, not reflecting the actual income available after maintaining the capital stock.
Factor Price Distortions
- Factor prices, like wages, rents, and interest, can be distorted by government interventions, subsidies, or price controls. For example, if the government imposes a price ceiling on rents or provides subsidies for interest rates, it could result in an inaccurate measure of national income.
Problems with Data Accuracy
- Accurate data on income sources is essential for the income method. However, in many economies, especially developing ones, income data may be inaccurate or incomplete due to factors like tax evasion, underreporting, and limited access to formal financial systems.
Exclusion of Environmental Costs
- The income method doesn’t consider the depletion or degradation of natural resources, such as forests, water, or minerals. For example, economic activities that degrade the environment or exhaust resources might show up as income, even though the long-term sustainability of such income is questionable.
Inability to Capture Real Welfare
- The income method focuses on money flows but does not account for changes in welfare or well-being. National income may increase due to factors like population growth or technological advancements, but it may not lead to a better quality of life for all citizens. For instance, rising income inequality may increase national income but reduce overall welfare.
Product/ Value Added Method
National income is calculated using this method as a flow of goods and services. During a year, we determine the monetary value of all final goods and services generated in an economy. The term “final goods” refers to goods that are consumed immediately rather than being employed in a subsequent manufacturing process.
Intermediate goods are goods that are used in the manufacturing process. Because the value of intermediate products is already included in the value of final goods, we do not count the value of intermediate goods in national income; otherwise, the value of goods would be double-counted.
To avoid duplicate counting, we can use the value-addition approach, which calculates value-addition (i.e., the value of the end good plus the value of the intermediate good) at each stage of production and then adds them together to get GDP.
The sum-total is the GDP at market prices since the money value is measured at market prices. The methods outlined before can be used to convert GDP at market price.
The flow of goods and services is used to calculate national income.
NI can be calculated as follows:
G.N.P. – COST OF CAPITAL – DEPRECIATION – INDIRECT TAXES = NATIONAL INCOME
Limitations of the Product/Value Added Method
Difficulties in Measuring the Value Added:
- One of the significant challenges of this method is accurately measuring the value added at each stage of production, especially in complex industries where the output of one firm becomes the input for another. This can lead to errors in determining the true value added if the accounting of intermediate goods is not precise.
Non-Market Production:
- The Value Added Method tends to ignore non-market activities such as household production or volunteer services, which contribute to the economy but do not involve market transactions. For example, the work done by homemakers or voluntary organizations is not included, even though it represents a substantial portion of the economy, particularly in developing countries.
Estimation of the Informal Sector:
- The informal sector, which includes unregistered businesses, is often a significant part of the economy, particularly in developing countries. Since these activities are not always recorded, national income may be underestimated when using the Value Added Method.
Complexity in Valuing Services:
- Estimating the value added by service sectors (e.g., healthcare, education, or financial services) can be challenging, especially when output is not easily quantifiable. For example, the value added by teachers in the education sector is difficult to measure, as it is not directly linked to tangible products.
Problems with Data Collection:
- The method relies heavily on accurate data collection at all levels of the economy, which can be difficult to obtain, especially in developing countries. Inaccurate or incomplete data on production processes, business output, and the cost of intermediate goods can lead to substantial errors in the national income estimate.
Impact of Depreciation:
- The Value Added Method does not directly account for depreciation of capital goods. Depreciation is the reduction in the value of assets due to wear and tear, which should ideally be subtracted to calculate Net National Income. The failure to consider depreciation in the Value Added Method leads to an overstatement of national income.
Exclusion of Environmental Costs:
- The Value Added Method does not consider the environmental impact of production activities, such as pollution or the depletion of natural resources. These externalities are significant in modern economies and can affect the long-term sustainability of economic growth. Therefore, national income estimates based on this method might not reflect the true cost of economic activities.
Inadequate Reflection of Income Distribution:
- While the Value Added Method provides a measure of national output, it does not capture how income is distributed within an economy. Thus, it cannot give insights into the welfare or inequality within a society, which can be critical for understanding the broader economic conditions.
Expenditure Method
National income is calculated using this method as a flow of expenditure. The gross domestic product (GDP) is the total of all private consumption expenditures. Government consumption expenditure, gross capital formation (public and private), and net exports are all factors to consider (Export-Import). As said above, the flow of expenditure is used to calculate national income.
The Expenditure technique can be used to calculate NI as follows:
National Income +National Product +National Expenditure=National Income +National Product +National Expenditure=National Expenditure.
Limitations of the Expenditure Method
Double Counting
- One of the main criticisms of the expenditure method is the potential for double counting. In particular, it is important to distinguish between final goods and intermediate goods. The expenditure method should only include spending on final goods to avoid inflating national income. However, if intermediate goods are not properly excluded, it can lead to an overestimation of national income.
Excludes Non-Market Activities
- The expenditure method fails to account for non-market activities such as household work and volunteer services, which contribute significantly to the economy but are not included in market transactions. These activities often go unrecorded, resulting in an incomplete measure of national income.
Difficulty in Valuing Government Expenditure
- Government spending (G) is included in the expenditure method, but it can be difficult to properly value government services. For example, government spending on defense or public administration may not result in the production of tangible goods and services that can be easily priced. As a result, the inclusion of government expenditure may overstate the true value of national income if the services provided are not appropriately valued.
Excludes the Informal or Underground Economy
- Like other methods of national income measurement, the expenditure method does not fully capture the informal or underground economy, which includes unregistered businesses and illicit activities. This can be particularly problematic in developing economies, where a significant portion of economic activity may not be recorded, leading to an underestimate of the true national income.
Impact of Imports and Exports
- The method accounts for net exports (exports minus imports), but this can present challenges, especially in economies with fluctuating trade balances. For example, a country with large imports but smaller exports may have a negative net export figure, which could distort the overall picture of national income. Additionally, exchange rate fluctuations can affect the valuation of exports and imports, adding volatility to GDP calculations.
Changes in Stock Values and Investment
- The expenditure method includes investments (I), but it may not fully account for changes in stock or asset values over time. Investment figures may reflect purchases of goods and services but not the appreciation or depreciation of those assets. This can lead to discrepancies between the total expenditure and the actual increase in economic productivity.
Does Not Reflect Income Distribution
- While the expenditure method provides a snapshot of total spending, it does not provide insights into how national income is distributed among different segments of society. High levels of national income could mask significant income inequality, leaving policymakers unaware of disparities in income distribution.
National income accounting involves measuring the total economic activity within a country. This process differs depending on whether the economy is closed (not interacting with other economies through trade or finance) or open (actively engaged in international trade and investment). Understanding these distinctions is crucial because open economies must account for additional factors like exports, imports, and capital flows. This distinction impacts how we calculate and interpret economic metrics, including Gross Domestic Product (GDP) and Gross National Product (GNP).
1. Closed Economy
A closed economy is self-contained, meaning it has no trade or financial interactions with other countries. In such an economy, all goods and services produced and consumed are confined within its borders. Examples of near-closed economies are rare today; however, North Korea has long been relatively isolated with limited international trade.
National Income Accounting in a Closed Economy
In a closed economy, the national income identity is simplified because there are no imports or exports. The total production and income within the country rely only on domestic consumption, investment, and government spending.
The national income identity in a closed economy can be represented as:
Y=C+I+G
where:
- Y = National income or GDP,
- C = Consumption expenditure by households,
- I= Investment by businesses,
- G= Government expenditure.
In this model:
- Consumption refers to the total spending by households on goods and services.
- Investment represents business spending on capital goods, such as machinery and infrastructure, that help increase future production.
- Government expenditure includes all government spending on goods and services, including public infrastructure, defense, and education.
Example of National Income Accounting in a Closed Economy
Consider an economy where households spend $500 million, businesses invest $300 million, and government spending totals $200 million. Using the closed-economy formula:
Y=500+300+200=1000
Thus, the national income (GDP) in this closed economy would be $1 billion. Here, all economic activity and spending originate internally, with no imports or exports involved
2. Open Economy
An open economy engages in international trade and financial transactions, buying and selling goods, services, and assets across borders. Most modern economies are open to some extent, interacting globally to leverage comparative advantages, access larger markets, and stimulate growth.
National Income Accounting in an Open Economy
In an open economy, the national income identity must account for exports and imports. The expanded formula is:
Y=C+I+G+(X−M)Y = C + I + G + (X – M)
where:
- YY = National income or GDP,
- CC = Consumption expenditure,
- II = Investment,
- GG = Government expenditure,
- XX = Exports (goods and services sold abroad),
- MM = Imports (goods and services purchased from abroad).
In this model:
- Exports are goods and services produced domestically but sold internationally, adding to national income.
- Imports are goods and services produced abroad but consumed domestically, subtracted from national income as they represent spending on foreign production.
Example of National Income Accounting in an Open Economy
Assume an economy where households spend $500 million, businesses invest $300 million, and government spending is $200 million. Additionally, exports total $100 million, and imports are $80 million. Using the open-economy formula:
Y=500+300+200+(100−80)=1020Y = 500 + 300 + 200 + (100 – 80) = 1020
Here, national income (GDP) would be $1.02 billion. The difference between exports and imports, known as the net exports, contributes an additional $20 million to the economy’s national income.
Key Differences between Closed and Open Economy Accounting
-
International Trade and Net Exports:
- In a closed economy, net exports are always zero, as there is no trade.
- In an open economy, net exports can be positive (trade surplus) or negative (trade deficit), affecting national income directly.
-
Income from Abroad:
- Open economies also account for income earned abroad by their residents and subtract income earned by foreigners within their borders to arrive at Gross National Product (GNP).
- For example, if a company in the United States operates a factory in Canada, the income generated by that factory would be added to U.S. GNP but not GDP.
-
Policy Implications and Economic Flexibility:
- In a closed economy, policies focus solely on domestic production and consumption without needing to account for international prices, exchange rates, or trade balances.
- Open economies must consider exchange rate policies, trade tariffs, and global economic conditions, which significantly influence national income.
-
Impact on Economic Growth:
- Open economies often grow faster due to access to larger markets, foreign investment, and technology transfer, unlike closed economies that rely entirely on internal resources.
Estimating national income is crucial for understanding a country’s economic health, guiding policy decisions, and tracking economic progress. National income, or the total value of goods and services produced within a country, can be calculated through three main methods: the Production Method, Income Method, and Expenditure Method. Each has its specific approach, advantages, and limitations, which influence its accuracy and applicability in different economic scenarios.
1. Production Method
The production method, also known as the output or value-added method, calculates national income by measuring the total value added by each industry within an economy. This approach tallies the value of all final goods and services produced in a country, deducting the cost of intermediate goods used in production to avoid double-counting.
The formula used in the production method is:
National Income=Gross Value of Output−Value of Intermediate Consumption\text{National Income} = \text{Gross Value of Output} – \text{Value of Intermediate Consumption}
Advantages
- It provides a direct view of sectoral contributions, offering insights into which sectors drive economic growth.
- Suitable for economies with well-defined industries, allowing for a clear breakdown by sectors like agriculture, manufacturing, and services.
Limitations
While the production method is a valuable tool for estimating national income, it has several limitations:
Valuation Difficulties:
- Non-Market Activities: The production method primarily focuses on market-based activities. Non-market activities, such as household production or volunteer work, are often excluded or undervalued, leading to an underestimation of total economic output.Services: Valuing services, especially those that are intangible or have fluctuating quality, can be challenging. For instance, accurately assessing the value of services like education, healthcare, or legal services can be difficult.
- Non-Market Activities: The production method primarily focuses on market-based activities. Non-market activities, such as household production or volunteer work, are often excluded or undervalued, leading to an underestimation of total economic output.
Informal Sector:
- The informal sector, which often operates outside the formal economy, is difficult to capture in national income calculations.This sector, which includes unregistered businesses and informal employment, can significantly contribute to economic activity but may be underreported or omitted entirely
- The informal sector, which often operates outside the formal economy, is difficult to capture in national income calculations.
Multiple Counting:
- To avoid double-counting, it’s crucial to only consider the value added at each stage of production.However, in practice, there’s a risk of double-counting if intermediate goods and services are not properly accounted for.
- To avoid double-counting, it’s crucial to only consider the value added at each stage of production.
Data Quality and Availability:
- The accuracy of national income estimates depends on the quality and availability of data. In many countries, data collection systems may be inadequate, leading to data inconsistencies and errors
- In developing countries, particularly, data collection can be challenging due to a lack of infrastructure and resources
International Comparability:
- Differences in economic structures, data collection methodologies, and exchange rate regimes can make international comparisons of national income challenging.
2. Income Method
The income method calculates national income by summing all the incomes earned by individuals and businesses in the economy, including wages, rents, interests, and profits. This approach provides a total of all factor incomes generated within a country in a given period.
The formula for the income method is:
National Income=Wages+ Rent +Interest +Profits +Mixed Income of Self-employed
Advantages
- Reflects Income Distribution: This method is useful for understanding the income distribution within an economy, highlighting disparities.
- Accurate for Factor Payments: It provides accurate data on factor incomes, which can help in studying labor market trends, capital returns, and other income components.
Limitations
While the income method is a valuable tool for measuring national income, it has several limitations:
Hidden Economy:
- The informal sector, which often operates outside the formal economy, can significantly contribute to economic activity but may not be fully captured in income data. This can lead to an underestimation of national income.
- It can be difficult to accurately estimate income from informal activities, such as street vendors, small-scale businesses, and domestic workers.
Transfer Payments:
- Transfer payments, such as social security benefits, unemployment benefits, and pensions, are not considered part of national income as they do not represent income generated from production.
- However, these payments can significantly impact household income and consumption patterns.
Imputed Income:
- The income derived from non-market activities, such as owner-occupied housing or self-consumption, can be difficult to accurately measure and may be excluded or underrepresented in national income calculations.
Data Quality and Availability:
- The accuracy of national income estimates depends on the quality and availability of data. In many countries, data collection systems may be inadequate, leading to data inconsistencies and errors.
- In developing countries, particularly, data collection can be challenging due to a lack of infrastructure and resources.
International Comparability:
- Differences in economic structures, data collection methodologies, and exchange rate regimes can make international comparisons of national income challenging.
- Adjusting for these differences is crucial for accurate cross-country comparisons.
3. Expenditure Method
The expenditure method calculates national income by totaling all expenditures incurred on final goods and services within an economy over a specific period. This approach considers consumption, investment, government spending, and net exports (exports minus imports).
The formula for the expenditure method is:
National Income=C+I+G+(X−M)
where:
- C = Consumer spending,
- I= Investment,
- G = Government spending,
- X = Exports, and
- M = Imports.
Advantages
- Captures Demand-Side Factors: This method provides insights into aggregate demand, which helps policymakers understand the consumption patterns and demand trends.
- Suitable for Open Economies: The expenditure method accounts for net exports, making it more applicable to open economies engaged in trade.
Limitations
While the expenditure method is a valuable tool for measuring national income, it has several limitations:
1.Data Accuracy and Reliability:
- Accurate data on consumption, investment, government spending, and net exports is crucial for accurate national income estimates.However, data collection can be challenging, especially for informal sector activities and government spending
Inaccuracies in data collection can lead to errors in national income calculations.
Black Market and Informal Economy:
- Economic activities in the informal sector, such as undeclared income and unreported transactions, are often excluded from official statistics. This can lead to an underestimation of national income
- Estimating the size and impact of the informal sector is challenging and requires careful analysis
Valuation of Government Services:
- Valuing government services, such as education and healthcare, can be difficult as they are often not directly priced in the market.
- Imputing values for these services can be subjective and may not accurately reflect their economic contribution
Inventory Valuation:
- Accurately valuing changes in inventories can be challenging, especially for perishable goods and goods with fluctuating prices.
- Errors in inventory valuation can affect the overall accuracy of national income estimates
International Trade Data:
- Accurate data on imports and exports is essential for calculating net exports. However, errors in customs declarations and undervaluation of imports can distort the trade balance and impact national income estimates .
There are many uses for national income accounting. The primary use is to measure economic activity and economic growth. Other uses include tracking trends, monitoring other economic statistics, adjusting monetary policy, helping public officials make policies, setting tax rates, or comparing economic data over time. provides a comprehensive picture of a nation’s economic health. It serves as a vital tool for policymakers, economists, and businesses to make informed decisions.
Here are some of its key uses:
Economic Growth Measurement:
- Tracking Growth: It helps measure the rate of economic growth over time.
- Policy Evaluation: Governments can assess the impact of economic policies on growth.
Economic Planning:
- Resource Allocation: It aids in allocating resources efficiently across different sectors.
- Policy Formulation: It provides data for formulating economic plans and targets.
Inter-sectoral Comparison:
- Sectoral Contribution: It helps analyze the contribution of various sectors to the economy.
- Policy Prioritization: It identifies sectors that need policy attention.
International Comparisons:
- Global Ranking: It allows comparing the economic performance of a country with others.
- Policy Learning: It facilitates learning from successful economic policies of other nations.
Standard of Living Measurement:
- Per Capita Income: It helps assess the average standard of living.
- Inequality Analysis: It can be used to study income distribution and inequality.
Business Decision Making:
- Market Analysis: Businesses can analyze market trends and potential.
- Investment Decisions: It helps businesses make informed investment decisions.
Difficulties in Correct Measurement of National Income
While National Income Analysis is a powerful tool, accurate measurement faces several challenges:
Informal Sector:
- Underreporting: The informal sector often underreports economic activity due to tax evasion and lack of records.
- Valuation Difficulty: Valuing services provided by the informal sector can be challenging.
Non-Market Activities:
- Household Production: Activities like household chores and volunteer work are often excluded.
- Environmental Costs: Environmental degradation and resource depletion aren’t always factored in.
Price Changes:
- Inflation and Deflation: Changes in price levels can distort the real value of economic activity.
- Choice of Price Index: The choice of price index can significantly impact the measurement.
Data Quality:
- Statistical Errors: Errors in data collection and processing can lead to inaccuracies.
- Data Consistency: Ensuring consistency in data collection over time can be difficult.
International Comparisons:
- Exchange Rate Issues: Using exchange rates to compare incomes across countries can be misleading due to differences in purchasing power parity.
- Economic Structure Differences: Different economic structures can affect the comparability of national income figures.
Government Interference:
- Political Bias: Governments may manipulate data to portray a positive economic picture.
- Statistical Manipulation: Statistical techniques can be misused to distort the true picture.